The CO2 footprint shows that: Rail is and will remain more environmentally friendly than road
In addition to other factors, investors who invest in infrastructure such as rail transport also do so because of its environmental friendliness. To show them the effect of their investments, the investment firm InRoll AG has used telematics data and other information sources to calculate the CO2 footprint of their freight wagons for the first time.
By Anil Mahawattage, Managing Director of InRoll AG
Steel, in particular, is used in manufacturing freight wagons, and processing it entails substantial energy consumption. Furthermore, there is considerable water consumption and waste production. However, freight wagon manufacturers currently do not publish any public information on their CO2 footprint. To give an approximation, InRoll has taken the initial step of calculating the material-related footprint, i.e., the resource consumption of steel and all other materials per freight wagon converted into CO2 equivalents using lifecycle data for a reference wagon with a particular unladen weight.
The second step involved calculating the production-related footprint, i.e., the resources that the freight wagon manufacturers consumed for an average wagon. In this case, it was possible to use the manufacturer’s primary data: On the one hand, the total consumption of the factory’s electricity and gas; on the other hand, the number of wagons produced in the factory using the said amount of electricity and gas. The aggregated, upstream CO2 emissions calculated in that manner for the production of an average new wagon weighing 65 tonnes was 175 t CO2 on average. As you will see below, these production-related emissions for a freight wagon are nonetheless negligible when compared to the emissions resulting from using and maintaining them.
Greater environmental efficiency of intermodal wagons
Wagons that can be/are used as frequently and as long as possible by the lessee are particularly environmentally efficient. This helps to spread out the manufacturing-related emissions across as many tonne-kilometres as possible. However, the differing maintenance requirements of the wagons must also be taken into account. For instance, intermodal wagons far outclass special freight wagons in both aspects: On average, the mileage of a standardised container wagon ranges from 150,000 to 200,000 kilometres, whilst for special freight wagons it is only 30,000 to 50,000 kilometres. Energy and water consumption when servicing the intermodal wagons is also far lower than with special freight wagons.
Calculation of CO2 emissions via wagon usage
Freight train trips can only be made with locomotives or railcars. They are generally powered by electricity, and diesel locomotives are used whenever there are no overhead power lines, such as on factory premises. The greenhouse gas emissions associated with power production differ significantly depending on the European country in which freight trains travel: Due to the reduction in coal power generation, the specific CO2 intensity in the EU27’s energy sector did indeed decrease to 226 g CO2 per kWh by 2020 (source: World Energy Council Germany). In comparison, the consumer electricity mix in Switzerland in 2018 was at a mere 128 g CO2eq per kWh due to the high proportion of renewable energies used (source: Federal Office for the Environment).
In their calculations on downstream, usage-based emissions data, InRoll has used various recognised data sources to obtain the relevant emissions factors in kg CO2 per tonne of freight per route km (tonne kilometre, tkm). However, the calculated emissions factor of 0.016 kg CO2 per tkm does not yet include any country-specific differences due to the lack of appropriate data.

Movement data is available thanks to telematics, but payload data is not yet available
Since a majority of their wagons are equipped with telematics, InRoll were able to use effective motion data in their calculations. However, despite the telematics, two important pieces of information are missing: Firstly, too few InRoll wagons have sensors that can effectively log the payload. As such, the maximum payload was calculated in terms of a “worst case” observation. Secondly, there is still no information on which locomotive and which engine type (electric or diesel) will be used to haul the wagons due to the fact that there are still no digital automatic couplings. So, a calculation for the entire route was carried out using the aforementioned average value (also a “worst-case” scenario).
In addition, maintenance-related emissions were also calculated using lifecycle data and reconciled using effective data on the frequency and requirements of the maintenance.
Usage dominates environmental effect; manufacturing is negligible in comparison
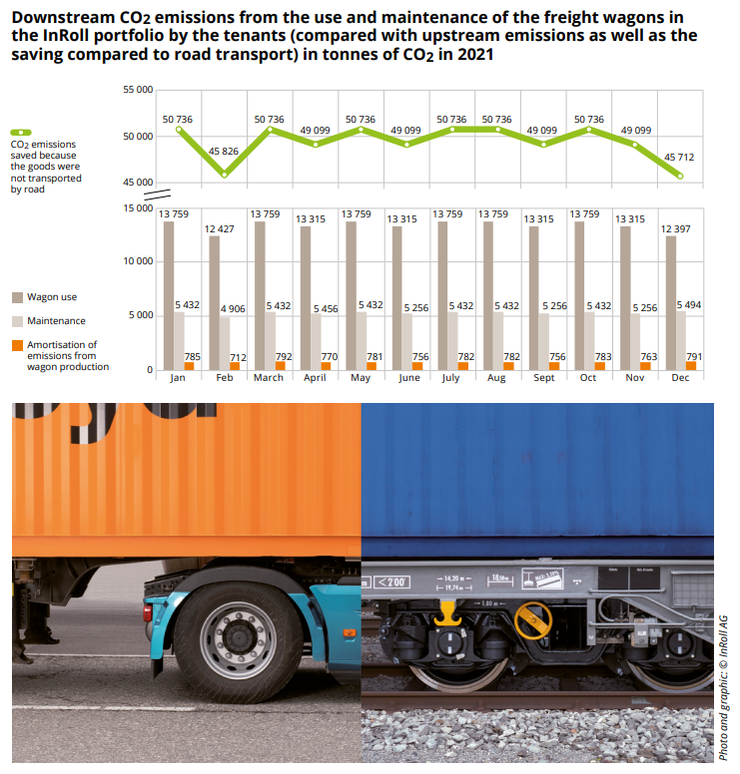
The graph below for the CO2 emissions produced in 2021 shows the following: In terms of scope, usage is clearly the most significant source of emissions from freight wagons, with wagon maintenance coming in second place. According to current calculations, the written-off CO2 emissions from the manufacturing of wagons are insignificant in comparison.
An unequivocal affirmation of rail’s environmental friendliness
The hypothetical comparison value of the estimated, saved CO2 emissions – also included in the figure – that would have been produced during the hypothetical transport of the same freight quantity by road once again shows that rail is far superior to road when it comes to emissions, even if a “worst-case scenario” is used for railways for lack of better data.


